
티스토리 뷰
1, 2, 3, 4편에서 인프라 구축, 로깅 / 모니터링 / 경보 시스템 구축, CI/CD 구축을 직접 해보았다면
이번 글에서는 테라폼으로 이것들을 수행할 수 있는 내용을 작성해보겠다.
원래는 인프라 구축을 AWS 내에서만 진행했기 때문에 AWS CloudFormation 으로 진행했었는데
다양한 프로바이더의 확장성을 고려하여 Terraform 으로 교체하게 되었다.
인프라 구축
- terraform-aws-modules 사용하여 코드 작성
- terraform-aws-modules 이 없는 모듈은 직접 resource 와 module 만들어서 사용
Terraform Registry
registry.terraform.io
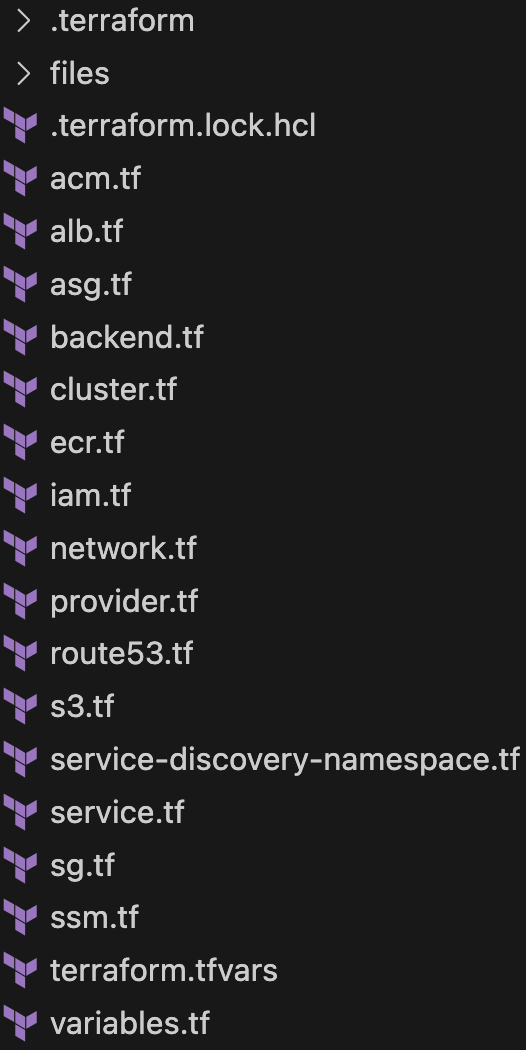
파일 설명
- acm
- AWS Certification Manager
- SSL 인증서 생성
- alb
- Application Load Balancer
- HTTPS 설정 (ACM 과 연결)
- HTTP -> HTTPS 리다이렉트
- host_header 설정으로 서브도메인과 PORT 연결
- 헬스체크 설정
- asg
- ECS 의 컨테이너 인스턴스의 auto scaling 을 담당
- EC2 의 시작 템플릿으로 ami 나 user data 등 설정
- cluster
- ECS 클러스터를 위한 설정
- ecr
- Elastic Container Registry
- SpringBoot API Server 의 이미지를 저장하는 Registry
- iam
- ECS 의 태스크, S3 등에 필요한 IAM role 을 생성
- network
- VPN, Subnet, Internet Gateway, NAT Gateway, Route Table 설정
- route53
- DNS, Sub domain 설정
- s3
- 로그를 저장할 버킷 생성 (Loki 와 연결)
- service-discovery-namespace
- ECS Cluster 내의 dns 설정 (Loki 컨테이너를 loki:3100 으로 접근 가능하도록 설정하기 위함)
- service
- ECS 의 Service 를 설정
- Grafana, Loki, SpringBoot API Server 서비스 생성
- sg
- 보안그룹 모음
- ssm
- Systems Manager 의 Parameter Store 사용
- ECR 주소를 환경변수로 저장해둠
CI/CD 구축
- terraform-aws-modules 으로 S3 등의 코드 작성
- resource "aws_codebuild_project", "aws_codepipeline" 등을 사용하여 코드 작성

파일 설명
- code-build
- build project 생성
- code-pipeline
- CI/CD 의 Pipeline 으로 source / build / deploy 구성
- iam
- CodeBuild 나 CodePipeline 에 필요한 IAM role 을 생성
- s3
- CodePipeline 에서 필요한 S3 Bucket 을 생성
Grafana 프로비저닝으로 로깅 / 모니터링 / 경보 시스템 구축
- Grafana Provider 로 코드 작성

- grafana_contact_point
- Alert 를 보낼 Slack 의 웹훅 주소로 설정
- 바디에 메시지 템플릿 설정
- 타이틀, 아이콘, 호출할 유저 등 설정
resource "grafana_contact_point" "slack_contact_point" {
  name = "slack"

  slack {
    url                     = "(슬랙 웹훅 URL)"
    username                = "[ERROR]"
    disable_resolve_message = true
    title                   = "에러가 발생했습니다."
    text                    = <<EOT
에러 발생 : {{ len .Alerts.Firing }}회

{{ range .Alerts.Firing }}
{{ template "Alert Instance Template" . }}
{{ end }}
EOT
  }
}- grafana_message_template
- Slack 에 실제로 보내질 Alert 메시지의 템플릿 생성
resource "grafana_message_template" "my_alert_template" {
  name = "Alert Instance Template"

  template = <<EOT
{{ define "Alert Instance Template" }}
발생 컨테이너 : {{ .Labels.container_name }}
에러 메시지 : {{ .Labels.log }}
{{ end }}
EOT
}- grafana_notification_policy
- 라벨을 통해 Slack 에 어떤 Alert 를 보낼지 지정
resource "grafana_notification_policy" "my_policy" {
  group_by      = []
  contact_point = grafana_contact_point.my_contact_point.name

  group_wait      = "1m"
  group_interval  = "1m"
  repeat_interval = "1m"

  policy {
    matcher {
      label = "job"
      match = "="
      value = "backend"
    }
    group_by      = ["..."]
    contact_point = grafana_contact_point.slack_contact_point.name
  }
}- grafana_rule_group
- 어떤 Alert 를 보낼건지 LogQL 과 여러 설정을 통해 생성
- ERROR 라는 키워드가 포함되어 있는 log 라벨이라면 Alert 를 보내게 설정
resource "grafana_rule_group" "my_alert_rule" {
  name             = "My Rule Group"
  folder_uid       = grafana_folder.data_source_dashboards.uid
  interval_seconds = 60
  org_id           = 1
  rule {
    name           = "My Alert Rule 1"
    for            = "1m"
    condition      = "C"
    no_data_state  = "OK"
    exec_err_state = "OK"
    annotations = {
    }
    labels = {
    }
    is_paused = false
    data {
      ref_id         = "A"
      query_type     = "range"
      datasource_uid = grafana_data_source.loki.uid
      relative_time_range {
        from = 60
        to   = 0
      }
      model = jsonencode({
        editorMode    = "code"
        expr          = "count_over_time({ecs_cluster=\"(클러스터 이름)\", job=\"backend\"} | log =~ `.+ERROR.+` | log !~ `.+-INFO.+` [1m])"
        hide          = false
        intervalMs    = 60000
        maxDataPoints = 43200
        refId         = "A"
        query_type    = "range"
      })
    }
    data {
      ref_id     = "B"
      query_type = ""
      relative_time_range {
        from = 60
        to   = 0
      }
      datasource_uid = "__expr__"
      model          = <<EOT
{
    "conditions": [
        {
        "evaluator": {
            "params": [
            0,0
            ],
            "type": "gt"
        },
        "operator": {
            "type": "and"
        },
        "query": {
            "params": []
        },
        "reducer": {
            "params": [],
            "type": "avg"
        },
        "type": "query"
      }
    ],
    "datasource": {
        "type": "__expr__",
        "uid": "__expr__",
        "name": "Expression"
    },
    "expression": "A",
    "intervalMs": 1000,
    "maxDataPoints": 43200,
    "refId": "B",
    "type": "reduce",
    "reducer": "last"
}
EOT
    }
    data {
      ref_id     = "C"
      query_type = ""
      relative_time_range {
        from = 60
        to   = 0
      }
      datasource_uid = "__expr__"
      model          = <<EOT
{
    "conditions": [
        {
        "evaluator": {
            "params": [
            0,0
            ],
            "type": "gt"
        },
        "operator": {
            "type": "and"
        },
        "query": {
            "params": []
        },
        "reducer": {
            "params": [],
            "type": "avg"
        },
        "type": "query"
      }
    ],
    "datasource": {
        "type": "__expr__",
        "uid": "__expr__",
        "name": "Expression"
    },
    "expression": "B",
    "intervalMs": 1000,
    "maxDataPoints": 43200,
    "refId": "C",
    "type": "threshold"
}
EOT
    }
  }
  depends_on = [
    grafana_dashboard.loki
  ]
}- grafana_folder
- Grafana Dashboard 를 저장할 폴더 설정
resource "grafana_folder" "data_source_dashboards" {
  title = "test folder data_source_dashboards"
}- grafana_data_source
- 로그를 긁어올 Loki 에 연결
- http://loki:3100
resource "grafana_data_source" "loki" {
  name        = "Loki1" # 데이터 소스의 이름
  type        = "loki"  # 데이터 소스 유형
  access_mode = "proxy" # 데이터 소스에 액세스하는 방법
  url         = "http://loki:3100"
}- grafana_dashboard
- Alert 를 쏠 대시보드
- 실제 로그들을 조회할 대시보드
resource "grafana_dashboard" "loki" {
  folder = grafana_folder.data_source_dashboards.id
  config_json = jsonencode({
    "editable" : true,
    "uid" : "test-ds-dashboard-uid"
    "panels" : [
      {
        "type" : "timeseries",
        "title" : "My Panel",
        "datasource" : "${grafana_data_source.loki.name}",
        "targets" : [
          {
            "refId" : "A",
            "queryType" : "range",
            "expr" : "count_over_time({ecs_cluster=\"(클러스터 이름)\", job=\"backend\"} | log =~ `.+ERROR.+` | log !~ `.+-INFO.+` [1m])",
            "alias" : "My Metric"
          }
        ]
      }
    ],
    "time" : {
      "from" : "now-6h",
      "to" : "now"
    },
    "title" : "My Dashboard test" # 대시보드의 이름은 여기에 정의합니다.
  })
  depends_on = [
    grafana_data_source.loki
  ]
}

resource "grafana_dashboard" "logs" {
  folder = grafana_folder.data_source_dashboards.id
  config_json = jsonencode({
    "editable" : true,
    "uid" : "logs-ds-dashboard-uid"
    "panels" : [
      {
        "type" : "logs",
        "title" : "Logs",
        "datasource" : "${grafana_data_source.loki.name}",
        "targets" : [
          {
            "refId" : "A",
            "queryType" : "range",
            "expr" : "{ecs_cluster=\"(클러스터 이름)\", job=\"backend\"}"
          }
        ]
      }
    ],
    "time" : {
      "from" : "now-6h",
      "to" : "now"
    },
    "title" : "Logs" # 대시보드의 이름은 여기에 정의합니다.
  })
  depends_on = [
    grafana_data_source.loki
  ]
}
https://registry.terraform.io/providers/grafana/grafana/latest/docs
Terraform Registry
registry.terraform.io
'인프라' 카테고리의 다른 글
댓글
공지사항
최근에 올라온 글
최근에 달린 댓글
- Total
- Today
- Yesterday
링크
TAG
- 모니터링
- github action
- 서버
- ci/cd
- ALB
- Grafana
- react
- SG
- LOKI
- Docker
- VPC
- AWS
- Service
- redux
- springboot
- 인프라
- javascript
- js
- RDS
- EC2
- CSS
- Hook
- 로깅
- ecr
- ECS
- Grafana Alert
- Workflow
- subnet
- 리액트
- html
| 일 | 월 | 화 | 수 | 목 | 금 | 토 |
|---|---|---|---|---|---|---|
| 1 | 2 | 3 | 4 | |||
| 5 | 6 | 7 | 8 | 9 | 10 | 11 |
| 12 | 13 | 14 | 15 | 16 | 17 | 18 |
| 19 | 20 | 21 | 22 | 23 | 24 | 25 |
| 26 | 27 | 28 | 29 | 30 | 31 |
글 보관함